Junjo Python SDK - API Reference
順序 (junjo): order, sequence, procedure
Junjo is a modern Python library for designing, executing, testing, and debugging complex, graph-based AI workflows.
Whether you’re building a simple chatbot, a complex data manipulation pipeline, or a sophisticated workflow with dynamic branching and parallel execution, Junjo provides the tools to define and debug your logic as a clear graph of nodes, edges, and state updates.
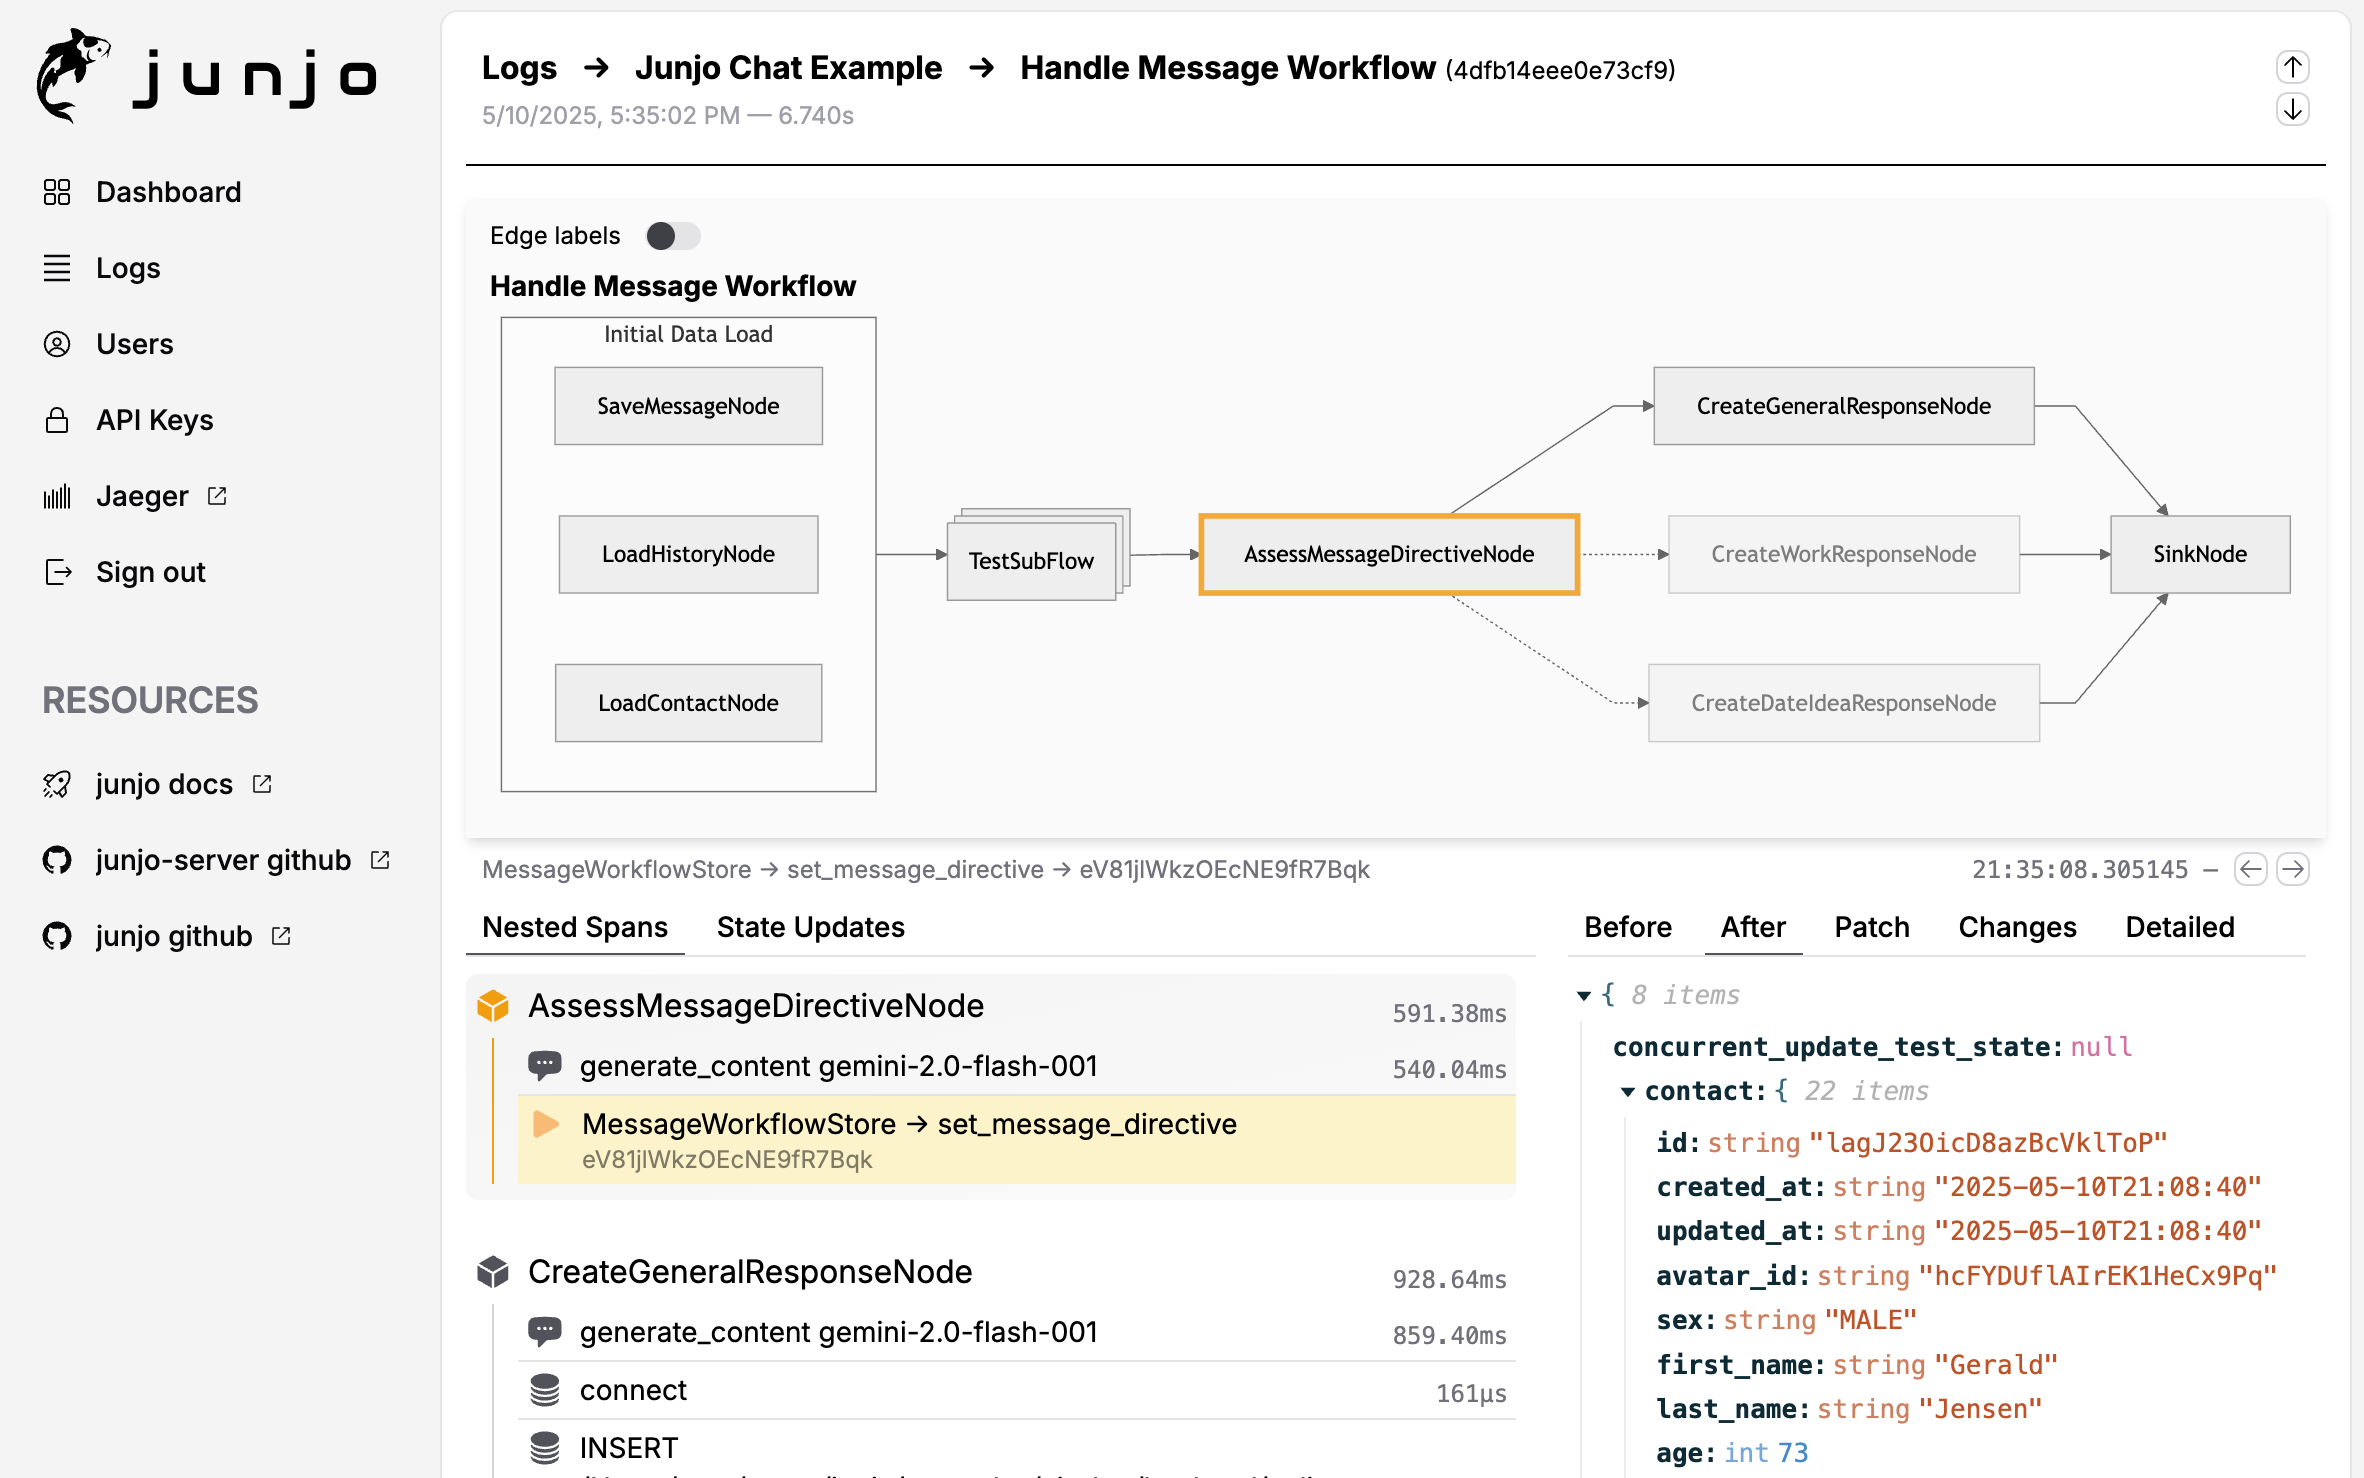
A screenshot of Junjo AI Studio, Junjo’s companion OpenTelemetry observability platform for debugging graph workflow state.
Benefits
✨ Visualize your AI workflows
🧠 Redux inspired state management and state debugging tools
⚡️ Concurrency and type safety native with asyncio and pydantic
🔗 Organize conditional chains of LLM calls into observable graph workflows
🏎️ Easy patterns for directed graph loops, branching, and concurrency
- 🧪 Eval-Driven Development focused
Build massive eval sets by mocking node state
Programmatically build and update eval sets with agentic code assistants
Eval patterns are based on pytest, leveraging its testing framework and capabilities
Rapidly iterate on your AI capabilities and avoid regressions
- 🔭 OpenTelemetry native
Provides organized, structured traces to any OpenTelemetry provider
Companion open source `Junjo AI Studio <https://github.com/mdrideout/junjo-ai-studio>`_ enhances debugging and evaluation of production data
Junjo’s Philosophy
🔍 Transparency
Junjo strives to be the opposite of a “black box”. Transparency, observability, eval driven development, and production data debugging are requirements for AI applications handling mission critical data, that need repeatable and high accuracy chained LLM logic.
⛓️💥 Decoupled
Junjo doesn’t change how you implement LLM providers or make calls to their services.
Continue using google-genai, openai-python, grok / xai sdk, anthropic-sdk-python, LiteLLM or even REST API requests to any provider.
Junjo remains decoupled from LLM providers. There are no proprietary implementations, no hijacking of python docstrings, no confusing or obfuscating decorators, and no middleman proxies.
Junjo simply helps you organize your python functions (whether they be logic, LLM calls, RAG retrieval, REST API calls, etc.) into a clean organized graph structure with predictable, testable, and observable execution.
🥧 Conventional
Junjo provides primitive building blocks that let you build any sort of executable workflow. From linear chains of LLM calls, to complex branching workflows with concurrent subflows, to fully autonomous agents.
Junjo uses conventional Pythonic architecture. Rather than obfuscating, proprietary decorators or runtime scripts that hijack execution, Junjo graph workflows are constructed conventionally with python classes and generics, and Pydantic models for type safe immutable state.
State is modeled after the conventional Elm Architecture, and inspired by Redux for clean separation of concerns, concurrency safety, and debuggability.
This helps your language server auto-complete methods and properties, and makes it easy for AI Coding agents to scaffold and understand massive Junjo workflows without needing to learn proprietary, library-specific logic patterns.
Junjo organizes conventional OpenTelemetry spans into easy to understand groups. Your existing OpenTelemetry provider will continue to work, now with enhanced span organization. Junjo AI Studio is a companion OpenTelemetry platform with enhanced visuals and debugging tools for Junjo workflows.
🤝 Compatible
Junjo can work alongside other AI Agent frameworks. Junjo Workflows can be setup as tools that Autonomous Agent frameworks can call for high-accuracy repeatable processes (like RAG retrieval or complex document parsing logic).
You can execute autonomous agent capabilities from other libraries inside a Junjo AI workflow. For example, a Junjo workflow node can run a smolagents tool calling agent as a single step within a greater Junjo workflow or subflow.
Getting Started
See the Installation page for installation and basic usage.
API Reference
See the API Reference page for the full API reference.
Eval-Driven Development
See the Eval-Driven Development page for more information on how to use Junjo for eval-driven development.