Junjo AI Studio Intro
Junjo AI Studio is a free, open-source telemetry visualization platform built specifically for debugging graph-based AI workflows. It ingests OpenTelemetry traces from your Junjo workflows and provides interactive tools to understand exactly what your LLMs are doing and why.
What is Junjo AI Studio?
Key Capabilities:
Interactive Graph Exploration: Click through your workflow’s execution path
State Machine Step Debugging: See every single state change, in order
LLM Decision Tracking: Understand which conditions evaluated true/false
Trace Timeline: Visualize concurrent execution and performance bottlenecks
Multi-Execution Comparison: Compare different runs to identify issues
Why Use Junjo AI Studio for AI Workflows?
LLM-powered applications are inherently non-deterministic. Traditional debugging doesn’t work well when:
You need to understand why an LLM chose path A over path B
State changes happen across multiple concurrent nodes
You’re testing complex agentic behaviors
You need to verify eval-driven development results
Junjo AI Studio solves this by providing complete execution transparency.
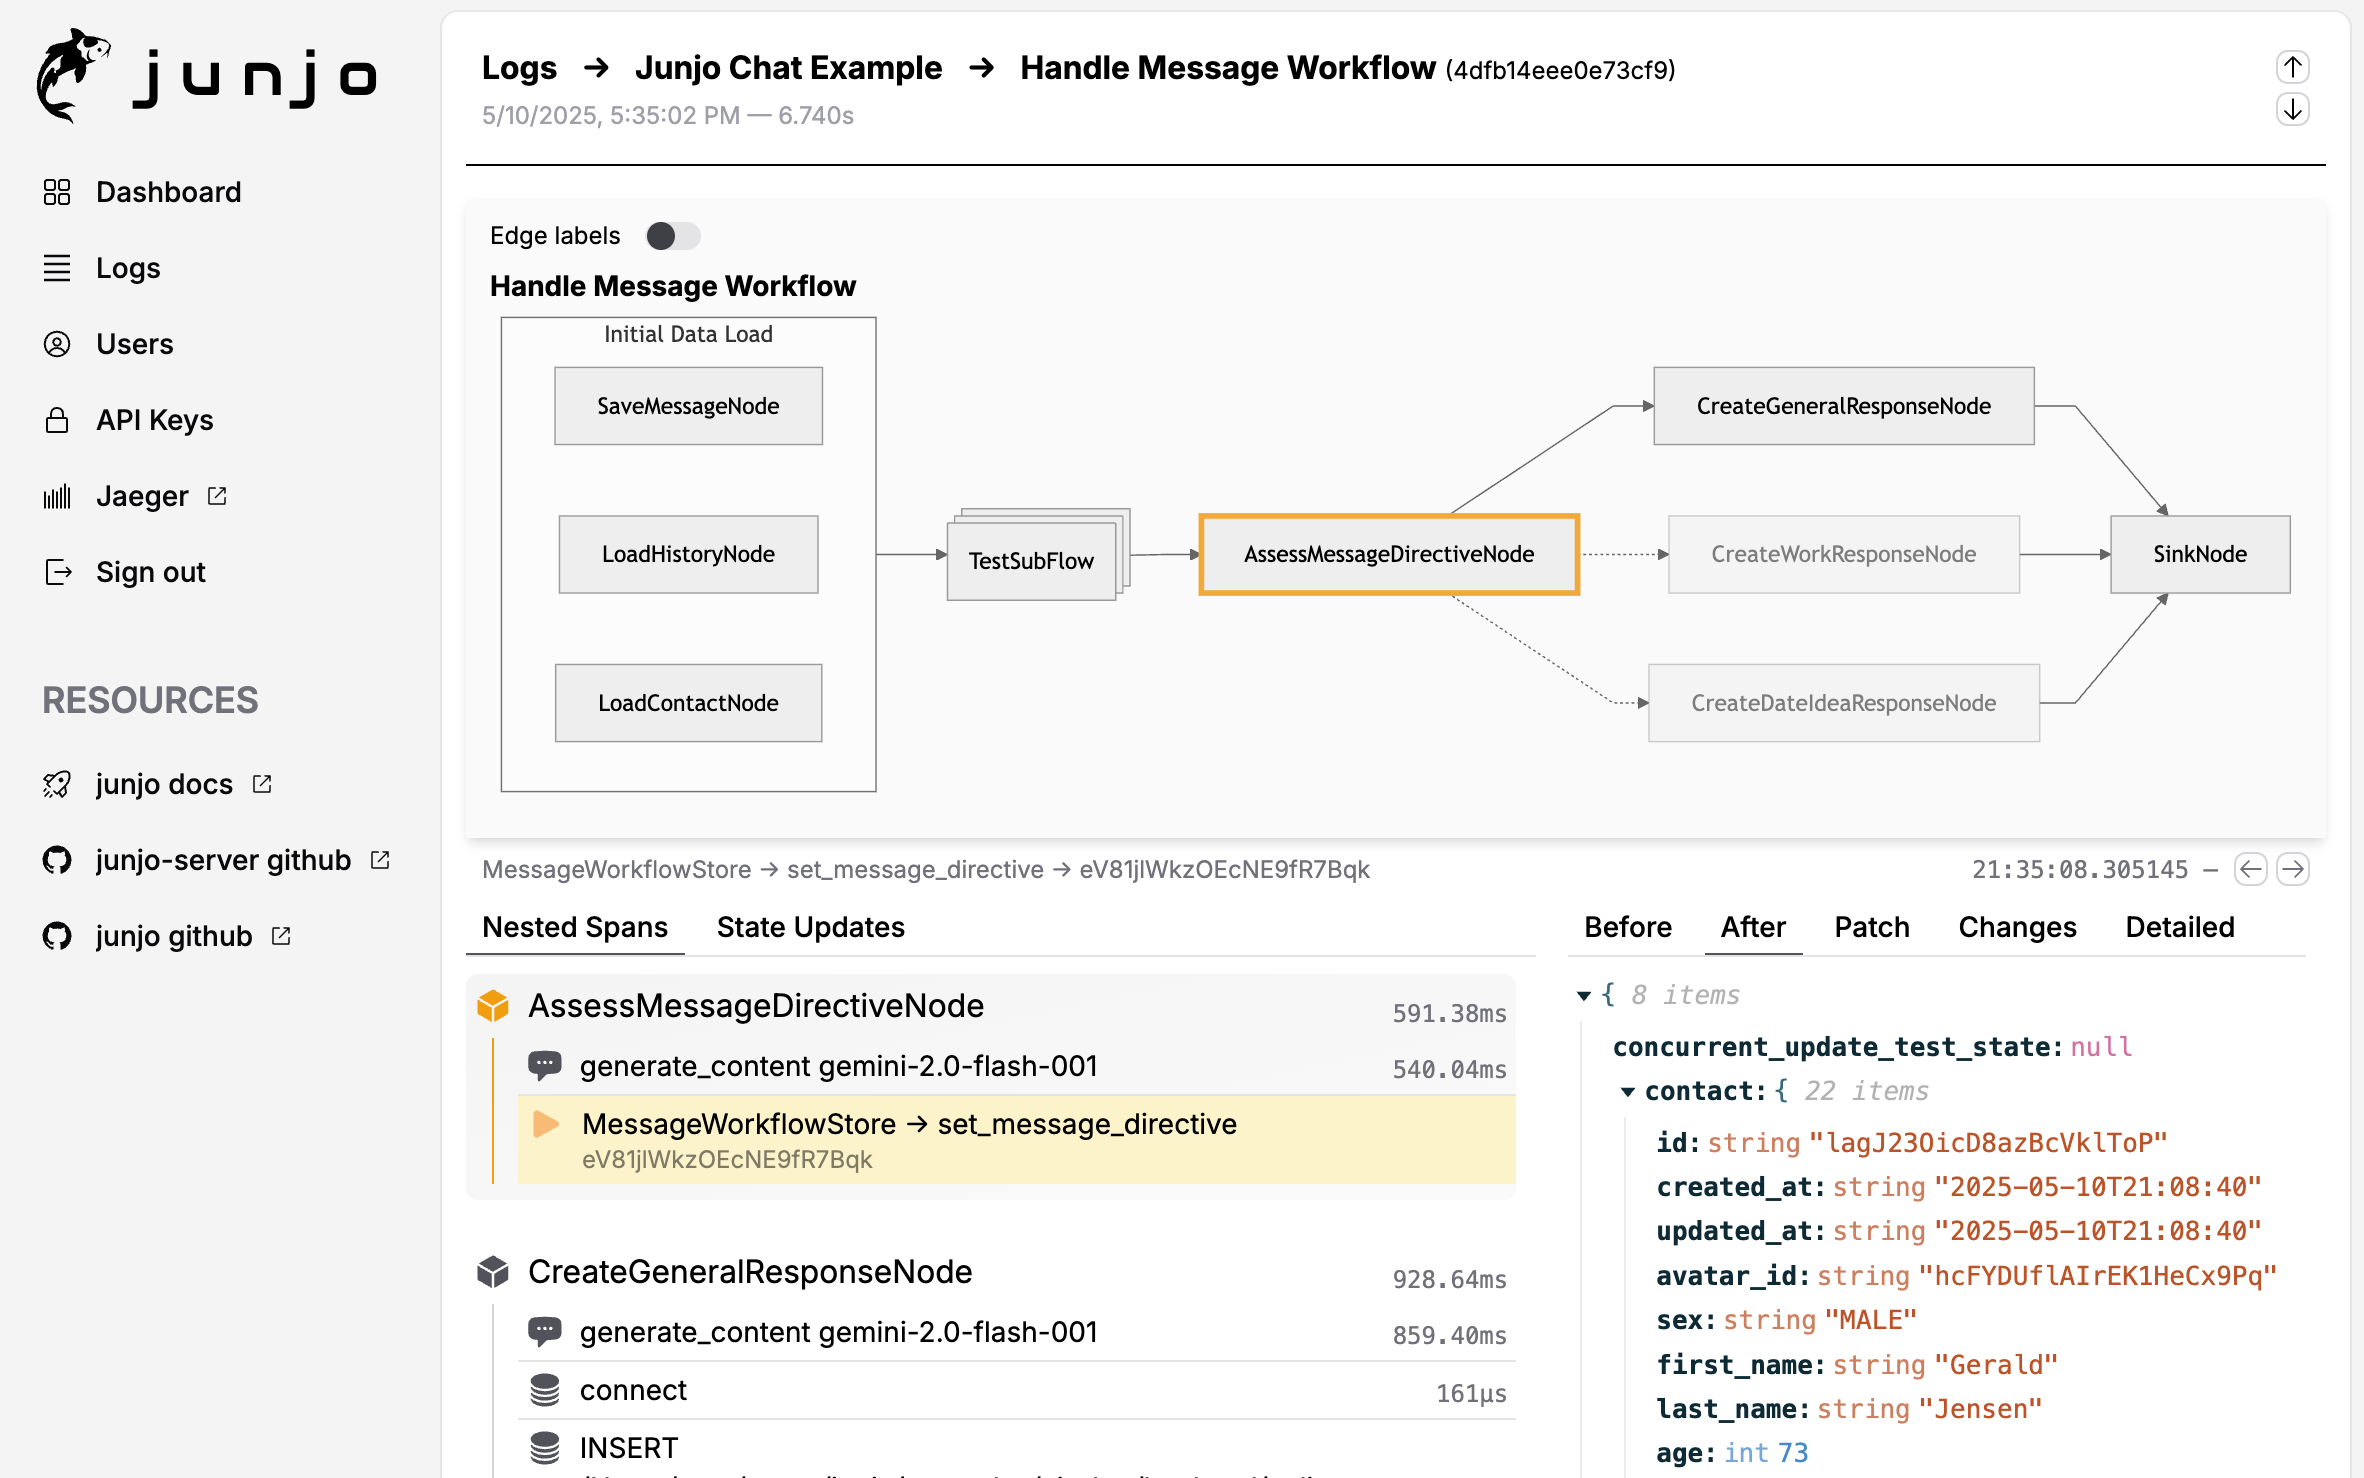
Interactive workflow graph showing execution path and state changes
Installation & Setup
Junjo AI Studio is composed of three Docker services that work together:
Backend: FastAPI HTTP API + auth, DataFusion queries over Parquet, plus a SQLite metadata index (and SQLite for users / API keys)
Ingestion Service: High-throughput OTLP receiver (Rust) with segmented Arrow IPC WAL → Parquet (cold), and on-demand hot snapshots for real-time queries
Frontend: Web UI for visualization and debugging
Quick Start Options
Option 1: Use the Minimal Build Template (Recommended)
The easiest way to get started is with the Junjo AI Studio Minimal Build Template, a GitHub template repository with a ready-to-use Docker Compose configuration:
# Clone the template repository
git clone https://github.com/mdrideout/junjo-ai-studio-minimal-build.git
cd junjo-ai-studio-minimal-build

# Configure environment
cp .env.example .env
# Edit .env with your settings

# Start services
docker compose up -d

# Access UI
open http://localhost:5153
This template provides a minimal, flexible foundation you can customize for your needs. See Junjo AI Studio Deployment for more details.
Option 2: Create Your Own Docker Compose File
If you prefer to integrate Junjo AI Studio into an existing project, here’s a minimal Docker Compose example:
services:
  junjo-ai-studio-backend:
    image: mdrideout/junjo-ai-studio-backend:latest
    ports:
      - "1323:1323"   # HTTP API
    volumes:
      - ${JUNJO_HOST_DB_DATA_PATH:-./.dbdata}:/app/.dbdata
    env_file: .env
    environment:
      - INGESTION_HOST=junjo-ai-studio-ingestion
      - INGESTION_PORT=50052
      - RUN_MIGRATIONS=true
      - JUNJO_SQLITE_PATH=/app/.dbdata/sqlite/junjo.db
      - JUNJO_METADATA_DB_PATH=/app/.dbdata/sqlite/metadata.db
      - JUNJO_PARQUET_STORAGE_PATH=/app/.dbdata/spans/parquet
    networks:
      - junjo-network

  junjo-ai-studio-ingestion:
    image: mdrideout/junjo-ai-studio-ingestion:latest
    ports:
      - "50051:50051" # OTel data ingestion (your app connects here)
    volumes:
      - ${JUNJO_HOST_DB_DATA_PATH:-./.dbdata}:/app/.dbdata
    env_file: .env
    environment:
      - BACKEND_GRPC_HOST=junjo-ai-studio-backend
      - BACKEND_GRPC_PORT=50053
      - WAL_DIR=/app/.dbdata/spans/wal
      - SNAPSHOT_PATH=/app/.dbdata/spans/hot_snapshot.parquet
      - PARQUET_OUTPUT_DIR=/app/.dbdata/spans/parquet
    networks:
      - junjo-network
    depends_on:
      - junjo-ai-studio-backend

  junjo-ai-studio-frontend:
    image: mdrideout/junjo-ai-studio-frontend:latest
    ports:
      - "5153:80" # Web UI
    env_file: .env
    networks:
      - junjo-network
    depends_on:
      - junjo-ai-studio-backend
      - junjo-ai-studio-ingestion

networks:
  junjo-network:
    driver: bridge
Start the services:
# Create .env file (see Configuration section below)
cp .env.example .env

# Start all services
docker compose up -d

# Access the UI
open http://localhost:5153
Resource Requirements
Junjo AI Studio is designed to run on minimal resources:
CPU: Single shared vCPU is sufficient
RAM: 1GB minimum
Storage: Uses SQLite + Parquet (cold storage) + Arrow IPC WAL segments (hot storage)
This makes it affordable to deploy on small cloud VMs.
Configuration
Step 1: Generate an API Key
Open Junjo AI Studio UI at http://localhost:5153
Navigate to Settings → API Keys
Create a new API key
Set the key in your application’s environment as
JUNJO_AI_STUDIO_API_KEY
Step 2: Configure OpenTelemetry in Your Application
Install the required OpenTelemetry packages:
pip install opentelemetry-sdk opentelemetry-exporter-otlp-proto-grpc
Create an OpenTelemetry configuration file:
import os
from junjo.telemetry.junjo_otel_exporter import JunjoOtelExporter
from opentelemetry import trace, metrics
from opentelemetry.sdk.trace import TracerProvider
from opentelemetry.sdk.metrics import MeterProvider
from opentelemetry.sdk.resources import Resource

def init_telemetry(service_name: str):
    """Configure OpenTelemetry for Junjo AI Studio."""

    # Get API key from environment
    api_key = os.getenv("JUNJO_AI_STUDIO_API_KEY")
    if not api_key:
        raise ValueError("JUNJO_AI_STUDIO_API_KEY environment variable not set. "
                       "Generate a new API key in the Junjo AI Studio UI.")

    # Create OpenTelemetry resource
    resource = Resource.create({"service.name": service_name})

    # Set up tracer provider
    tracer_provider = TracerProvider(resource=resource)

    # Configure Junjo AI Studio exporter
    junjo_exporter = JunjoOtelExporter(
        host="localhost",  # Junjo AI Studio ingestion service host
        port="50051",      # Port 50051 receives OpenTelemetry data
        api_key=api_key,
        insecure=True  # Use False in production with TLS
    )

    # Add span processor for tracing
    tracer_provider.add_span_processor(junjo_exporter.span_processor)
    trace.set_tracer_provider(tracer_provider)

    # (Optional) Set up metrics
    meter_provider = MeterProvider(
        resource=resource,
        metric_readers=[junjo_exporter.metric_reader]
    )
    metrics.set_meter_provider(meter_provider)
Step 3: Initialize Telemetry in Your Application
Call the initialization function before executing workflows:
from otel_config import init_telemetry

# Initialize telemetry
init_telemetry(service_name="my-ai-workflow")

# Execute your workflow - telemetry is automatic!
await my_workflow.execute()
Key Features Deep Dive
1. Interactive Graph Visualization
Click on any node in the execution graph to:
See the exact state when that node executed
View state patches applied by that node
Drill down into subflows
Explore concurrent execution branches
The graph shows the actual path taken during execution, making it easy to understand which conditions were met and which branches were followed.
2. State Step Debugging
The state timeline shows every state update in chronological order:
Which node made each change
What the state looked like before/after
JSON patch diffs for precise changes
Filter by state fields
This is critical for understanding:
Why certain conditions evaluated the way they did
How data flows through your workflow
Where unexpected state mutations occur
LLM decision-making patterns
3. Trace Exploration
Full OpenTelemetry trace view with:
Span durations (find performance bottlenecks)
Error tracking and stack traces
LLM call details (when using OpenInference)
Custom attributes from your code
4. Multi-Execution Comparison
Compare executions side-by-side:
Same workflow with different inputs
Before/after prompt changes
Successful vs failed runs
Different LLM models
Using with OpenInference for LLM Tracing
Junjo AI Studio automatically displays LLM-specific data when you instrument with OpenInference:
# Install OpenInference instrumentation for your LLM provider
pip install openinference-instrumentation-google-genai
from openinference.instrumentation.google_genai import GoogleGenAIInstrumentor

# After setting up OpenTelemetry tracer provider
GoogleGenAIInstrumentor().instrument(tracer_provider=tracer_provider)
You’ll see in Junjo AI Studio:
Full prompt text
LLM responses
Token usage
Model parameters
Latency metrics
Junjo-Specific Telemetry Attributes
Junjo automatically adds these attributes to OpenTelemetry spans:
Workflow Spans
junjo.span_type: “workflow” or “subflow”junjo.id: Unique workflow instance IDjunjo.workflow.state.start: Initial state JSONjunjo.workflow.state.end: Final state JSONjunjo.workflow.graph_structure: Graph definitionjunjo.workflow.node.count: Number of nodes executedjunjo.workflow.store.id: Store instance ID
Node Spans
junjo.span_type: “node”junjo.id: Unique node instance IDjunjo.parent_id: Parent workflow/subflow ID
Subflow Spans
junjo.parent_id: Parent workflow IDjunjo.workflow.parent_store.id: Parent store ID
These attributes power Junjo AI Studio’s specialized visualization and debugging features.
Complete Example
See working examples in the repository:
Using Other OpenTelemetry Platforms
Important: Junjo’s telemetry works with any OpenTelemetry platform. The JunjoOtelExporter is specifically for Junjo AI Studio, but all Junjo-specific span attributes are automatically included when you use standard OTLP exporters.
You can use Junjo AI Studio alongside other platforms:
# Use both Junjo AI Studio AND Jaeger
from opentelemetry.exporter.otlp.proto.grpc.trace_exporter import OTLPSpanExporter
from opentelemetry.sdk.trace.export import BatchSpanProcessor

# Junjo AI Studio
junjo_exporter = JunjoOtelExporter(
    host="localhost",
    port="50051",
    api_key=api_key,
    insecure=True
)
tracer_provider.add_span_processor(junjo_exporter.span_processor)

# Also send to Jaeger
jaeger_exporter = OTLPSpanExporter(endpoint="http://jaeger:4317")
tracer_provider.add_span_processor(BatchSpanProcessor(jaeger_exporter))
Platforms like Jaeger, Grafana, Honeycomb, etc. will receive all Junjo spans with their custom attributes, though they won’t have Junjo AI Studio’s specialized workflow visualization.
Architecture Details
Junjo AI Studio uses a three-service architecture for scalability and reliability:
Your Application (Junjo Python Library)
       ↓ (sends OTel spans via gRPC + x-junjo-api-key)
Ingestion Service :50051
       ↓ (writes segmented Arrow IPC WAL, flushes to Parquet)
       ↓ (backend calls internal gRPC :50052 for hot snapshot + recent cold paths)
Backend Service :1323
       ↓ (indexes cold Parquet metadata into SQLite, queries Parquet via DataFusion)
       ↓ (serves HTTP API)
Frontend :5153
       (web UI)
Port Reference:
50051: Public gRPC - Your application sends telemetry here
50052: Internal gRPC - Backend calls ingestion (PrepareHotSnapshot / FlushWAL)
50053: Internal gRPC - Ingestion calls backend (ValidateApiKey)
1323: Public HTTP - API server
5153: Public HTTP - Web UI
Troubleshooting
No data appearing in Junjo AI Studio
Verify API key is set correctly:
echo $JUNJO_AI_STUDIO_API_KEYCheck services are running:
docker compose psEnsure ingestion service is accessible on port 50051
Look for connection errors in your application logs
Check ingestion service logs:
docker compose logs junjo-ai-studio-ingestion
Missing LLM data
Install OpenInference instrumentors:
pip install openinference-instrumentation-<provider>Call
.instrument()after setting up the tracer providerVerify the instrumentation is active in your application startup
Performance issues
Use sampling for high-volume workflows
The ingestion service uses a segmented Arrow IPC WAL and streams flushes to Parquet (constant memory)
The backend indexes new Parquet files asynchronously and queries cold + hot data with deduplication
See Junjo AI Studio repository for tuning options
Docker Compose not starting
Ensure Docker network exists:
docker network create junjo-networkCheck environment variables are set in
.envView logs:
docker compose logsTry:
docker compose down -v && docker compose up --build
Next Steps
Explore OpenTelemetry Integration for general OpenTelemetry configuration
Learn about Visualizing AI Workflows for static Graphviz diagrams
See Eval-Driven Development for testing workflows
Review Concurrency for understanding parallel execution traces